
Comparing the best Freight Analytics Software of 2026 includes 1. CargoEZ 2. project44 3. FourKites 4. GoComet 5. Microsoft Power BI 6. Xeneta 7. Magaya Supply Chain 8. Descartes 9. Beacon 10. Freightos Terminal.
TL;DR
- CargoEZ: best for analytics native to a forwarder operational data, so profit per file, lane margin, and volume trends come from the same system that runs the shipment. G2 4.8/5 across 40 reviews (G2 reviews).
- project44: best overall for shipment visibility analytics and network benchmarking. Carrier-connected ETAs, dwell, and transit reporting across ocean, air, rail, and truck, with 4.7/5 on G2 (G2 reviews).
- FourKites: best for predictive analytics and lane benchmarking against a large shipper network. 4.5/5 on G2 (G2 reviews).
- GoComet: best for freight spend and procurement analytics with reverse-auction RFQ data and invoice audit. Capterra 4.8/5 across 51 reviews (Capterra reviews).
- Microsoft Power BI: best BI layer for building custom freight dashboards on top of your TMS export. From $14/user/mo (Power BI pricing).
Freight analytics splits into visibility platforms, spend and procurement tools, rate-benchmark data services, and plain BI layers, and the four groups draw on different source feeds. A dedicated visibility or benchmarking platform leads for pure analytics, while CargoEZ earns the top spot for forwarders that want reporting native to their own operational data. This compares ten tools on data coverage, dashboard depth, pricing, and where the numbers tend to drift from what actually happened.
What is freight analytics software?
Freight analytics software turns shipment, cost, and carrier data into dashboards and reports that a forwarder or NVOCC can act on, covering freight spend, lane margin, transit performance, carrier reliability, and exception rates.
Tools in this space differ by data source. Visibility platforms like project44 and FourKites build on carrier and AIS feeds, CargoEZ and Magaya report on the forwarder own operational records, GoComet and Xeneta focus on procurement and rate data, and Power BI is a general layer you point at any export.
Best Freight Analytics Software comparison: features, pricing and verdicts
| Tool | Best for | Starting price | Free trial | External rating |
|---|---|---|---|---|
Best for analytics built on a forwarder own operational and financial data | Custom quote | Free demo | G2 4.8/5 (40 reviews) | |
Best overall for carrier-connected shipment visibility analytics and benchmarking | Custom quote | Free demo | G2 4.7/5 (747 reviews) | |
Best for predictive lane analytics measured against a large shipper network | Custom quote | Free demo | G2 4.5/5 (269 reviews) | |
Best for freight spend, procurement, and invoice-audit analytics | Custom quote | Free demo | G2 4.9/5 (242 reviews) | |
Best BI layer for building custom freight dashboards on a TMS export | From $14/user/mo | Free trial | G2 4.5/5 (1,657 reviews) | |
Best for ocean and air freight rate benchmarking data | Custom quote | Free demo | No public reviews | |
Best for US SMB forwarders wanting operational dashboards inside the forwarding system | Custom quote | Free demo | G2 4.4/5 (309 reviews) | |
Best for trade data, customs, and import-export market analytics | Custom quote | Demo only | G2 4.3/5 (82 reviews) | |
Best for combined shipment visibility and freight cost analytics for growing forwarders | Custom quote | Free demo | Capterra 4.5/5 (8 reviews) | |
Best for market freight rate indices and pricing trend analytics | Free indices; Terminal Pro custom quote | Free tier | Capterra 4.1/5 (28 reviews) |
How we chose these tools
This list is organized around data sources, because a freight analytics tool is only as good as the feeds behind it. Tools were grouped by where their numbers originate, carrier and AIS connections, forwarder operational records, procurement events, or market rate indices, then assessed on dashboard depth, custom reporting, pricing accessibility, and recurring themes in G2 and Capterra review samples read in August 2026. Pure real-time tracking tools with no reporting layer, shipper-only enterprise TMS analytics, and parcel dashboards are out of scope. Vendor blogs and vendor comparison pages were not used as neutral evidence.
Read the full CEOPickz.com testing methodology, the scoring criteria, weights, and the data we collect for every tool.
Detailed reviews
What's great
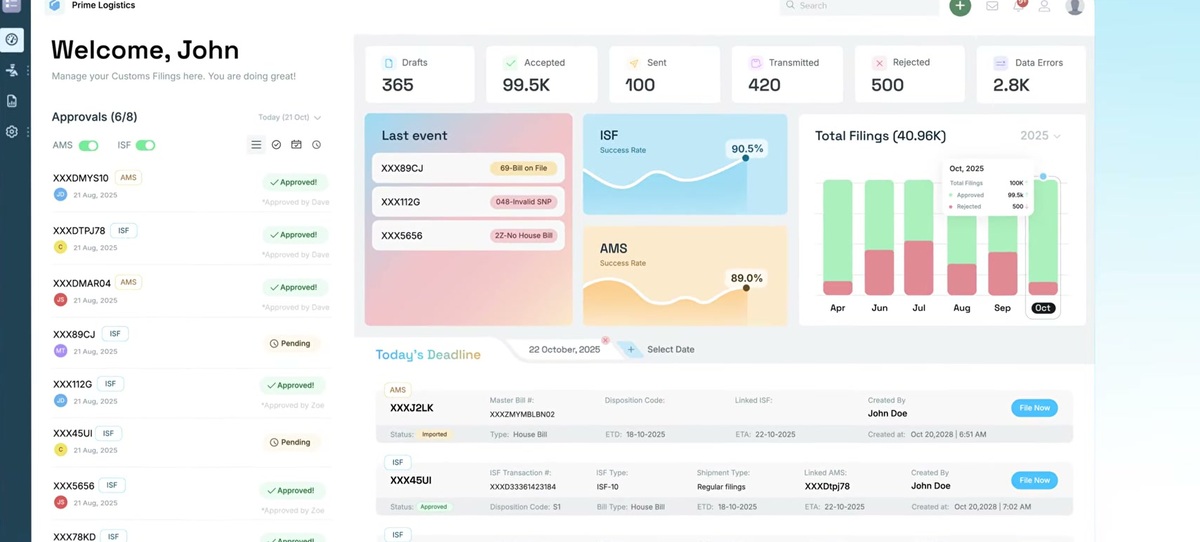
- Dashboards for profit per file, lane and customer margin, volume trends, and receivables that draw straight from the same system running quotes, operations, and invoicing
- Multi-currency accounting inside the platform, so freight cost analytics reconcile to the ledger instead of an export
- Operational KPIs like file cycle time, document turnaround, and customs status sit next to the financial view with no integration to maintain
Watch-outs
- Reporting is about your own book of business, so there is no external carrier or market benchmarking
- G2 review base is small at 40, so third-party validation of the analytics module specifically is thin
- Quote-only pricing with no public tiers, so you cannot size the cost before a sales call
CargoEZ earns a top-3 place here for a specific reason: its analytics are native to the forwarder operational data rather than a separate feed you have to reconcile. Because quoting, operations, customs, and multi-currency accounting run in one platform, profit per file and lane margin come out clean. Its G2 profile sits at 4.8/5 across 40 reviews.
A dedicated visibility platform such as project44 will out-report it on carrier performance and network benchmarking, and CargoEZ does not pretend otherwise. What it gives you instead is financial and operational reporting with nothing to integrate and no data drift between the dashboard and the invoice.
Best for small to mid-size US forwarders and NVOCCs that want margin, volume, and receivables analytics from the system of record. Wrong for teams whose main analytics need is external carrier benchmarking or market rate trends.
Pricing breakdown
| Plan | Price | Best for |
|---|---|---|
| Core FMS reporting | Custom quote | Forwarders needing operational and margin dashboards |
| FMS + accounting analytics | Custom quote | Adding profit-per-file and multi-currency financial reporting |
| Full Suite | Custom quote | Forwarders adding WMS, CRM, and cross-module BI |
Security & compliance
| Standard | Availability |
|---|---|
| Audit logs | Yes |
| GDPR | Yes |
| HIPAA | No |
| SOC 2 Type II | Yes |
| SSO / SAML | Yes |
CargoEZ compliance summary: Audit logs is yes, GDPR is yes, HIPAA is no, SOC 2 Type II is yes, and SSO / SAML is yes.
Key integrations
| Integration | Type |
|---|---|
| Gmail | N/A |
| Outlook | N/A |
| Slack | N/A |
| LinkedIn Sales Navigator | N/A |
| Outreach / Salesloft | N/A |
CargoEZ integration summary: Gmail is not specified, Outlook is not specified, Slack is not specified, LinkedIn Sales Navigator is not specified, and Outreach or Salesloft is not specified.
Feature availability
| Feature | Status |
|---|---|
| Custom report builder | ✓ |
| Freight spend audit | ✓ (vs ledger) |
| Prebuilt dashboards | ✓ |
| Predictive eta | M |
| Rate benchmarking | ✗ |
CargoEZ feature availability summary: Custom report builder (✓), Freight spend audit (✓ (vs ledger)), Prebuilt dashboards (✓), Predictive eta (M), and Rate benchmarking (✗).
Loading reviews…
What's great
- Large carrier and ocean AIS network feeding transit-time, dwell, detention, and on-time reporting across ocean, air, rail, parcel, and truckload in one dashboard
- Network benchmarking that compares your lane performance and carrier reliability against anonymized aggregate data, which few forwarder-native tools can do
- Exception and milestone analytics with configurable alerts, so the dashboard drives action rather than just recording history
Watch-outs
- It reports on movement and performance, not on your gross margin or billing, so it sits alongside a forwarding system rather than replacing its reporting
- Enterprise pricing scaled to volume, with a real integration project to connect your TMS and carriers
- Data quality depends on carrier participation, so smaller regional carriers and NVOCC co-loads can show gaps
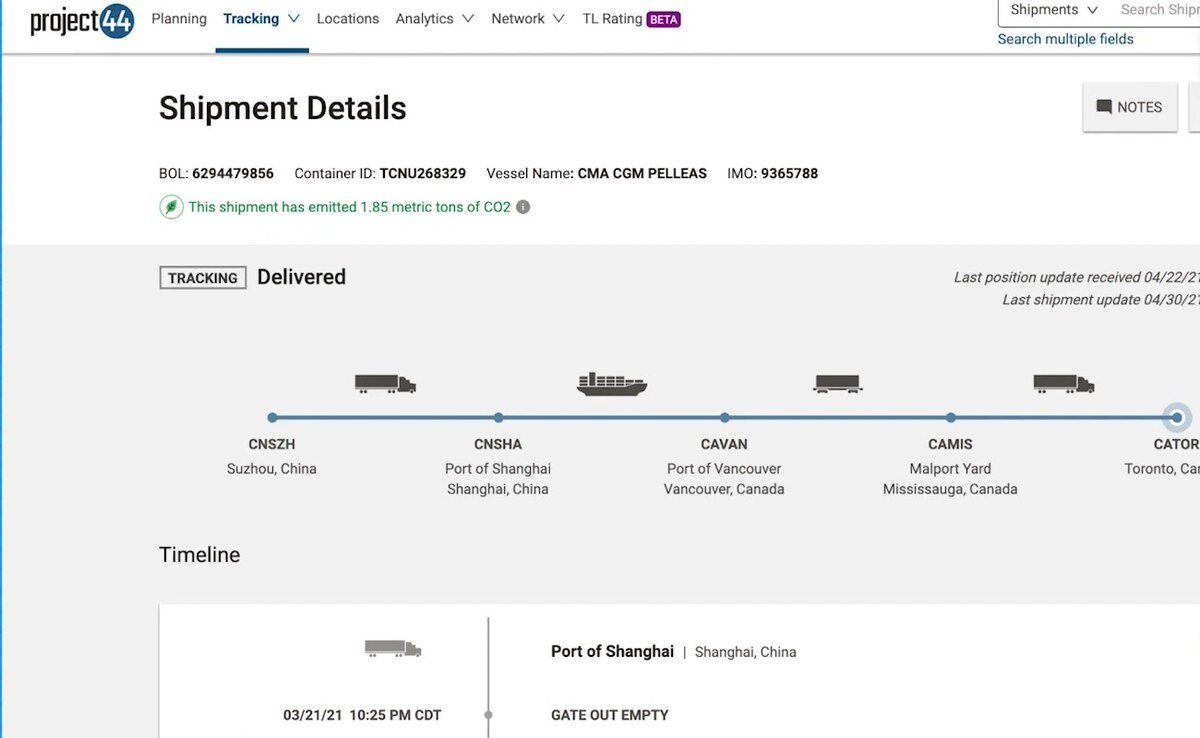
project44 is the pick when the questions you need answered are about movement: which lanes are slipping, which carriers miss ETAs, where containers sit, and how your transit times compare to everyone else shipping the same corridor. Its G2 profile sits at 4.7/5, with reviewers citing breadth of carrier coverage and the benchmarking view.
The analytics are built on a wide carrier and AIS feed, so ocean dwell, rail transit, and truckload on-time all land in the same reporting layer, and the Movement platform adds configurable exception dashboards. What it does not do is tell you whether a file made money, that stays in your forwarding or accounting system.
Expect a volume-based subscription and an integration effort to wire in your shipment and carrier data. Best for mid-size and larger US forwarders that want carrier performance analytics and external benchmarking. Wrong for a small forwarder that mainly needs profit-per-file reporting from its own records.
Pricing breakdown
| Plan | Price | Best for |
|---|---|---|
| Visibility (core) | Custom quote | Forwarders needing multimodal tracking and transit analytics |
| Advanced analytics + benchmarking | Custom quote | Teams comparing lane and carrier performance to network data |
| Enterprise | Custom quote | High-volume forwarders with many carrier and TMS integrations |
Security & compliance
| Standard | Availability |
|---|---|
| Audit logs | Yes |
| GDPR | Yes |
| HIPAA | No |
| SOC 2 Type II | Yes |
| SSO / SAML | Yes |
project44 compliance summary: Audit logs is yes, GDPR is yes, HIPAA is no, SOC 2 Type II is yes, and SSO / SAML is yes.
Key integrations
| Integration | Type |
|---|---|
| Gmail | N/A |
| Outlook | N/A |
| Slack | N/A |
| LinkedIn Sales Navigator | N/A |
| Outreach / Salesloft | N/A |
project44 integration summary: Gmail is not specified, Outlook is not specified, Slack is not specified, LinkedIn Sales Navigator is not specified, and Outreach or Salesloft is not specified.
Feature availability
| Feature | Status |
|---|---|
| Custom report builder | ✓ |
| Freight spend audit | M |
| Prebuilt dashboards | ✓ |
| Predictive eta | ✓ |
| Rate benchmarking | ✗ |
project44 feature availability summary: Custom report builder (✓), Freight spend audit (M), Prebuilt dashboards (✓), Predictive eta (✓), and Rate benchmarking (✗).
Loading reviews…
What's great
- Predictive ETA and dwell models trained on a large tracked-shipment network, with lane-level benchmarking for transit and reliability
- Ocean, over-the-road, rail, and yard analytics in one place, plus appointment and facility performance reporting
- Network-wide dashboards for exception rates and carrier scorecards that update as shipments move
Watch-outs
- Positioned around shipper and 3PL use cases, so forwarder-specific reporting like house-bill margin is not the focus
- Smaller public review base than project44, and setup requires carrier onboarding to reach useful coverage
- No billing or accounting data, so spend analytics are limited to what you feed it
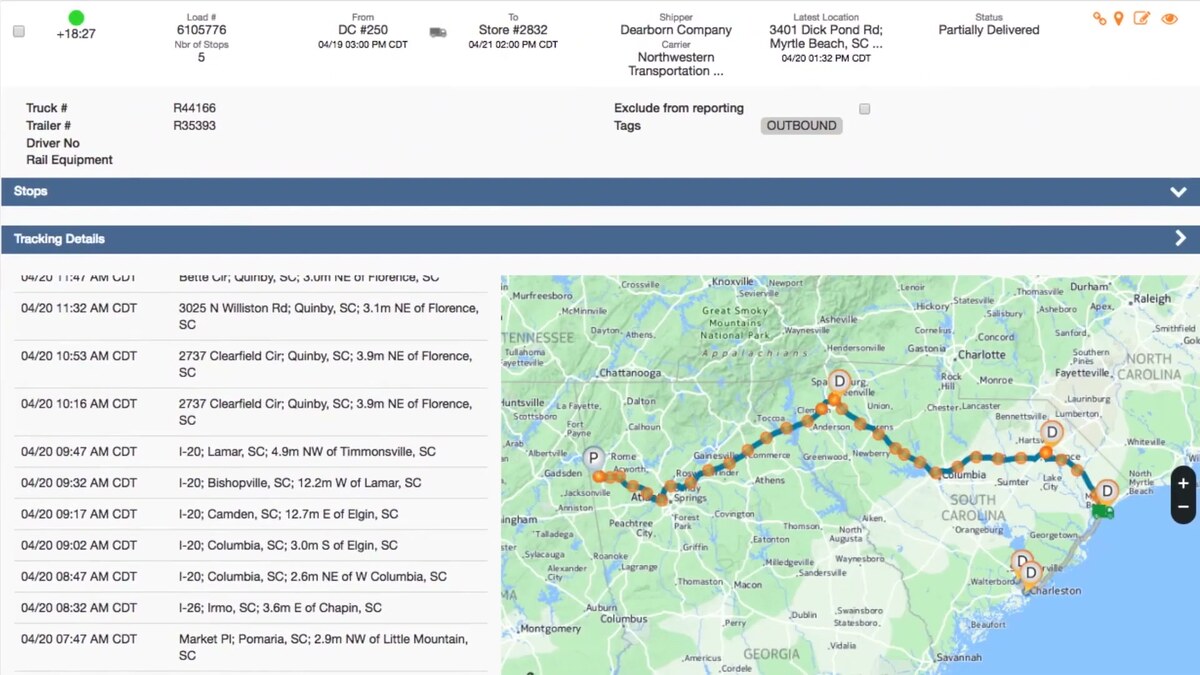
FourKites competes directly with project44 on visibility analytics, and its edge is the predictive layer: ETA and dwell forecasts built from a large network of tracked loads, with lane benchmarking that shows how your corridors stack up. Its G2 profile holds 4.5/5.
The reporting covers ocean, road, rail, and yard, with facility and appointment analytics that help forwarders spot where time is lost. As with any network tool, coverage depends on carrier participation, and reviewers note onboarding carriers is the slow part of go-live.
Best for forwarders and 3PLs that want predictive transit analytics and external lane benchmarks. Wrong for a team whose core need is margin and cost reporting from its own files, where a forwarder-native tool fits better.
Pricing breakdown
| Plan | Price | Best for |
|---|---|---|
| Tracking + analytics | Custom quote | Forwarders needing multimodal transit and dwell reporting |
| Network benchmarking | Custom quote | Teams comparing lane and carrier performance to peers |
| Enterprise | Custom quote | High-volume operations with facility and yard analytics |
Security & compliance
| Standard | Availability |
|---|---|
| Audit logs | Yes |
| GDPR | Yes |
| HIPAA | No |
| SOC 2 Type II | Yes |
| SSO / SAML | Yes |
FourKites compliance summary: Audit logs is yes, GDPR is yes, HIPAA is no, SOC 2 Type II is yes, and SSO / SAML is yes.
Key integrations
| Integration | Type |
|---|---|
| Gmail | N/A |
| Outlook | N/A |
| Slack | N/A |
| LinkedIn Sales Navigator | N/A |
| Outreach / Salesloft | N/A |
FourKites integration summary: Gmail is not specified, Outlook is not specified, Slack is not specified, LinkedIn Sales Navigator is not specified, and Outreach or Salesloft is not specified.
Feature availability
| Feature | Status |
|---|---|
| Custom report builder | M |
| Freight spend audit | ✗ |
| Prebuilt dashboards | ✓ |
| Predictive eta | ✓ |
| Rate benchmarking | ✗ |
FourKites feature availability summary: Custom report builder (M), Freight spend audit (✗), Prebuilt dashboards (✓), Predictive eta (✓), and Rate benchmarking (✗).
Loading reviews…
What's great
- Procurement analytics from reverse-auction RFQ events, so you see rate trends, supplier response, and savings versus baseline by lane
- Freight invoice audit that flags overbilling and reconciles charges against the agreed rate, feeding a recoverable-spend dashboard
- Multimodal container tracking with transit and detention reporting alongside the spend view, plus 4.8/5 on Capterra across 51 reviews
Watch-outs
- It complements rather than replaces a forwarding operations and accounting system
- Spend analytics quality depends on running procurement events inside the tool rather than over email
- Some data-refresh lag from smaller carriers on the tracking side
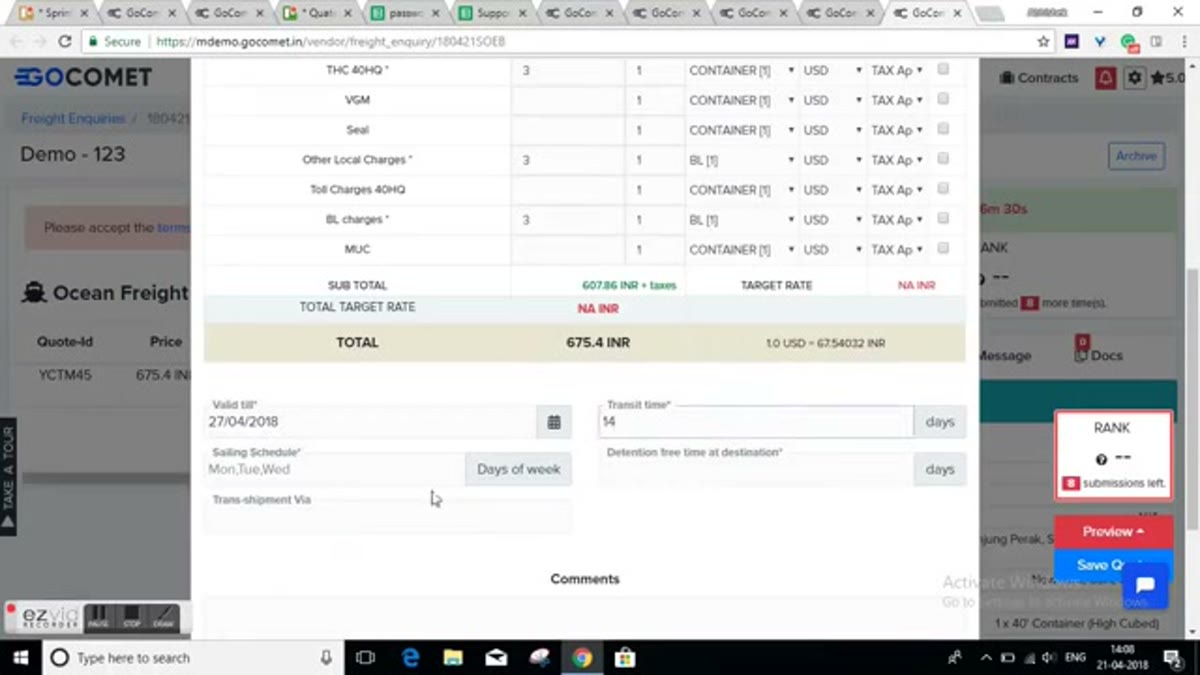
GoComet is the strongest pick when the analytics question is about money leaving the business: what you are paying by lane, whether rates are trending up, and how much of each invoice is wrong. It holds 4.8/5 on Capterra across 51 reviews and strong Gartner Peer Insights marks.
The reverse-auction RFQ tool turns procurement into structured data, so savings-versus-baseline and supplier-response dashboards are populated automatically, and the invoice-audit module quantifies recoverable overcharges. Tracking and detention reporting sit alongside it.
Best for forwarders and shippers focused on freight spend control and rate procurement analytics. Wrong as a single system of record for the shipment file or the ledger.
Pricing breakdown
| Plan | Price | Best for |
|---|---|---|
| GoProcure | Custom quote | Rate procurement and savings analytics |
| GoTrack | Custom quote | Container visibility and transit reporting |
| GoInvoice | Custom quote | Freight invoice audit and recoverable-spend dashboards |
Security & compliance
| Standard | Availability |
|---|---|
| Audit logs | Marketplace add-on |
| GDPR | Yes |
| HIPAA | No |
| SOC 2 Type II | Yes |
| SSO / SAML | Yes |
GoComet compliance summary: Audit logs is marketplace add-on, GDPR is yes, HIPAA is no, SOC 2 Type II is yes, and SSO / SAML is yes.
Key integrations
| Integration | Type |
|---|---|
| Gmail | N/A |
| Outlook | N/A |
| Slack | N/A |
| LinkedIn Sales Navigator | N/A |
| Outreach / Salesloft | N/A |
GoComet integration summary: Gmail is not specified, Outlook is not specified, Slack is not specified, LinkedIn Sales Navigator is not specified, and Outreach or Salesloft is not specified.
Feature availability
| Feature | Status |
|---|---|
| Custom report builder | M |
| Freight spend audit | ✓ (core) |
| Prebuilt dashboards | ✓ |
| Predictive eta | M |
| Rate benchmarking | M |
GoComet feature availability summary: Custom report builder (M), Freight spend audit (✓ (core)), Prebuilt dashboards (✓), Predictive eta (M), and Rate benchmarking (M).
Loading reviews…
What's great
- Points at any source your forwarding system can export, CSV, SQL, an API, or a data warehouse, so you are not limited to what a vendor dashboard exposes
- Published per-user pricing from $14/month, an order of magnitude cheaper than the enterprise visibility platforms
- Large skills pool and template gallery, and 4.5/5 on G2 across roughly 1,657 reviews
Watch-outs
- No freight knowledge out of the box, so someone has to model lanes, charges, and margin logic before a single chart is useful
- Data is only as fresh as your export or pipeline, which is where dashboards drift from operational reality
- Row-level security, gateways, and refresh scheduling add admin work at scale
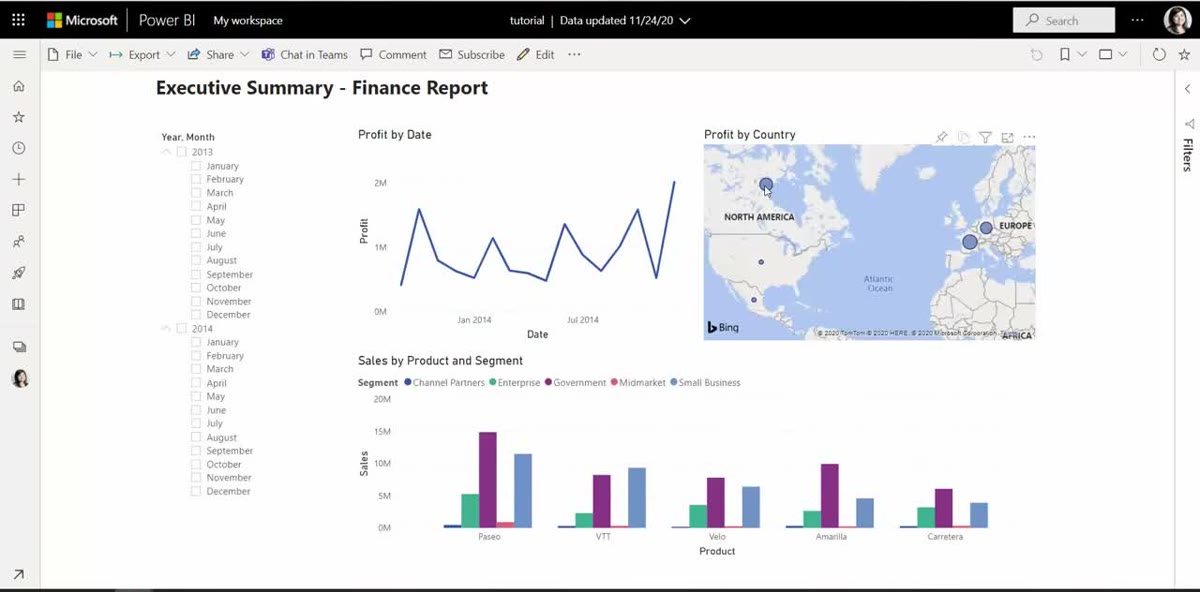
Power BI is not a freight tool, it is the layer many forwarders use to build the reporting their TMS will not. If your operational system can export shipments, charges, and payments, Power BI can turn that into margin, aging, and volume dashboards, and Microsoft’s pricing page lists Pro at $14 per user per month. It carries 4.5/5 on G2 .
The cost is modeling work. Someone has to define what a lane is, how charges roll up, and how to handle multi-currency, and the refresh cadence you choose determines how far the numbers lag the actual files.
Best for forwarders with a data-capable analyst and a system that exports cleanly. Wrong for teams that need carrier benchmarking or want dashboards on day one with no build.
Screenshots of Microsoft Power BI 3 images
Pricing breakdown
| Plan | Price | Best for |
|---|---|---|
| Free / Fabric trial | $0 | Single-analyst report building and evaluation |
| Pro | $14/user/mo | Small teams sharing freight dashboards |
| Premium Per User | ~$24/user/mo | Larger models, paginated reports, more frequent refresh |
Security & compliance
| Standard | Availability |
|---|---|
| Audit logs | Yes |
| GDPR | Yes |
| HIPAA | ✓ (with BAA) |
| SOC 2 Type II | Yes |
| SSO / SAML | Yes |
Microsoft Power BI compliance summary: Audit logs is yes, GDPR is yes, HIPAA is ✓ (with baa), SOC 2 Type II is yes, and SSO / SAML is yes.
Key integrations
| Integration | Type |
|---|---|
| Gmail | N/A |
| Outlook | N/A |
| Slack | N/A |
| LinkedIn Sales Navigator | N/A |
| Outreach / Salesloft | N/A |
Microsoft Power BI integration summary: Gmail is not specified, Outlook is not specified, Slack is not specified, LinkedIn Sales Navigator is not specified, and Outreach or Salesloft is not specified.
Feature availability
| Feature | Status |
|---|---|
| Custom report builder | ✓ (strong) |
| Freight spend audit | M (build it) |
| Prebuilt dashboards | M (templates) |
| Predictive eta | ✗ |
| Rate benchmarking | ✗ |
Microsoft Power BI feature availability summary: Custom report builder (✓ (strong)), Freight spend audit (M (build it)), Prebuilt dashboards (M (templates)), Predictive eta (✗), and Rate benchmarking (✗).
Loading reviews…
What's great
- Crowd-sourced ocean and air rate database covering millions of contracted and spot rates, so you can benchmark your buy against the market by corridor
- Analytics for rate trend, capacity, and how your negotiated rates rank against peer percentiles
- Useful as a negotiation input and a board-level market view rather than an operational report
Watch-outs
- It benchmarks price, not your operations or margin, so it is a narrow slice of freight analytics
- Subscription is priced for shippers and large forwarders, and value drops if your lane mix is thin
- Data reflects contributed rates, so obscure corridors have less depth
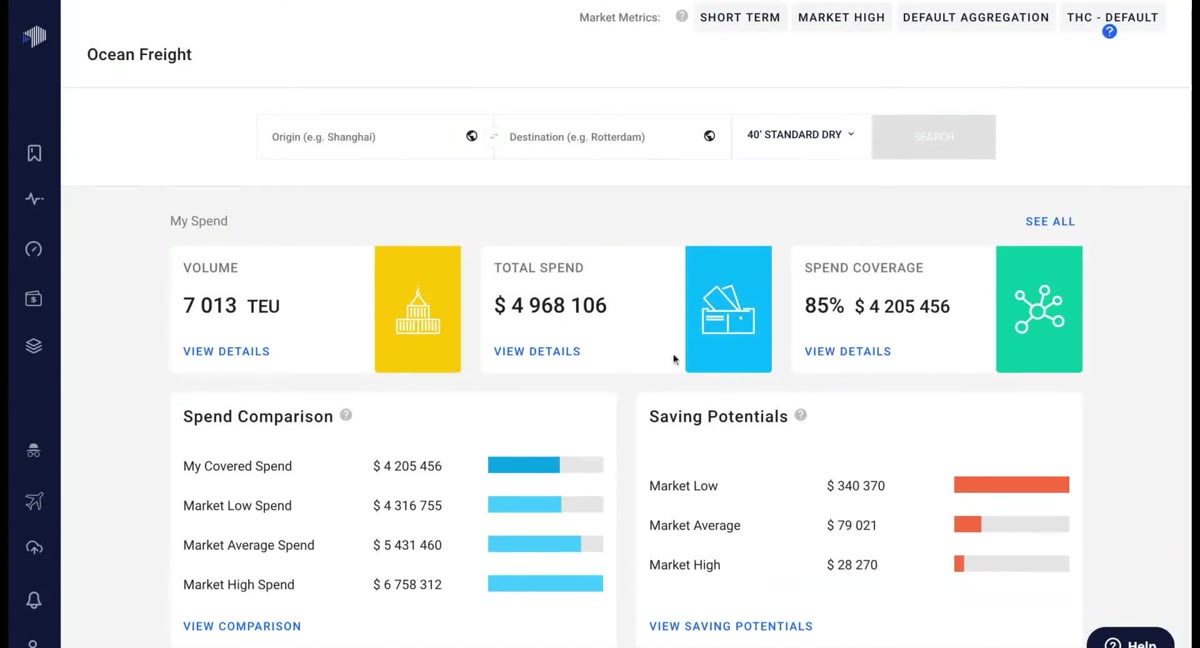
Xeneta answers one question well: is what you are paying for ocean and air freight in line with the market, and where do your rates sit against peers. The platform aggregates a large pool of contributed contract and spot rates and turns it into rate benchmarking and trend analytics .
This is analytics about the buy side of freight, not about your files or your P&L, so it usually sits next to a spend tool like GoComet or a forwarder-native reporting layer. On thinly traded corridors the benchmark is less reliable because fewer rates feed it.
Best for forwarders and shippers with enough volume to benefit from market rate intelligence in negotiations. Wrong for a small forwarder that needs operational or margin dashboards, not price benchmarks.
Pricing breakdown
| Plan | Price | Best for |
|---|---|---|
| Ocean benchmarking | Custom quote | Benchmarking ocean contract and spot rates by trade |
| Air benchmarking | Custom quote | Adding air cargo rate and capacity analytics |
| Enterprise / API | Custom quote | Feeding rate data into internal systems and reports |
Security & compliance
| Standard | Availability |
|---|---|
| Audit logs | Marketplace add-on |
| GDPR | Yes |
| HIPAA | No |
| SOC 2 Type II | Yes |
| SSO / SAML | Yes |
Xeneta compliance summary: Audit logs is marketplace add-on, GDPR is yes, HIPAA is no, SOC 2 Type II is yes, and SSO / SAML is yes.
Key integrations
| Integration | Type |
|---|---|
| Gmail | N/A |
| Outlook | N/A |
| Slack | N/A |
| LinkedIn Sales Navigator | N/A |
| Outreach / Salesloft | N/A |
Xeneta integration summary: Gmail is not specified, Outlook is not specified, Slack is not specified, LinkedIn Sales Navigator is not specified, and Outreach or Salesloft is not specified.
Feature availability
| Feature | Status |
|---|---|
| Custom report builder | M |
| Freight spend audit | M |
| Prebuilt dashboards | ✓ (rate views) |
| Predictive eta | ✗ |
| Rate benchmarking | ✓ (core) |
Xeneta feature availability summary: Custom report builder (M), Freight spend audit (M), Prebuilt dashboards (✓ (rate views)), Predictive eta (✗), and Rate benchmarking (✓ (core)).
Loading reviews…
Magaya Supply Chain
Best for US SMB forwarders wanting operational dashboards inside the forwarding systemWhat's great
- Built-in dashboards and a report writer over the forwarding, WMS, and customs data already in the system, so operational KPIs need no integration
- Largest US SMB install base in this set, with 309 G2 reviews at 4.4/5, and strong marks for document and report generation
- LiveTrack customer portal exposes shipment status data that feeds the same reporting layer
Watch-outs
- Reporting is about your own records only, with no carrier or market benchmarking
- Reviewers describe parts of the interface, including some report screens, as dated
- Deeper cross-module analytics can push you toward exporting to an external BI tool anyway
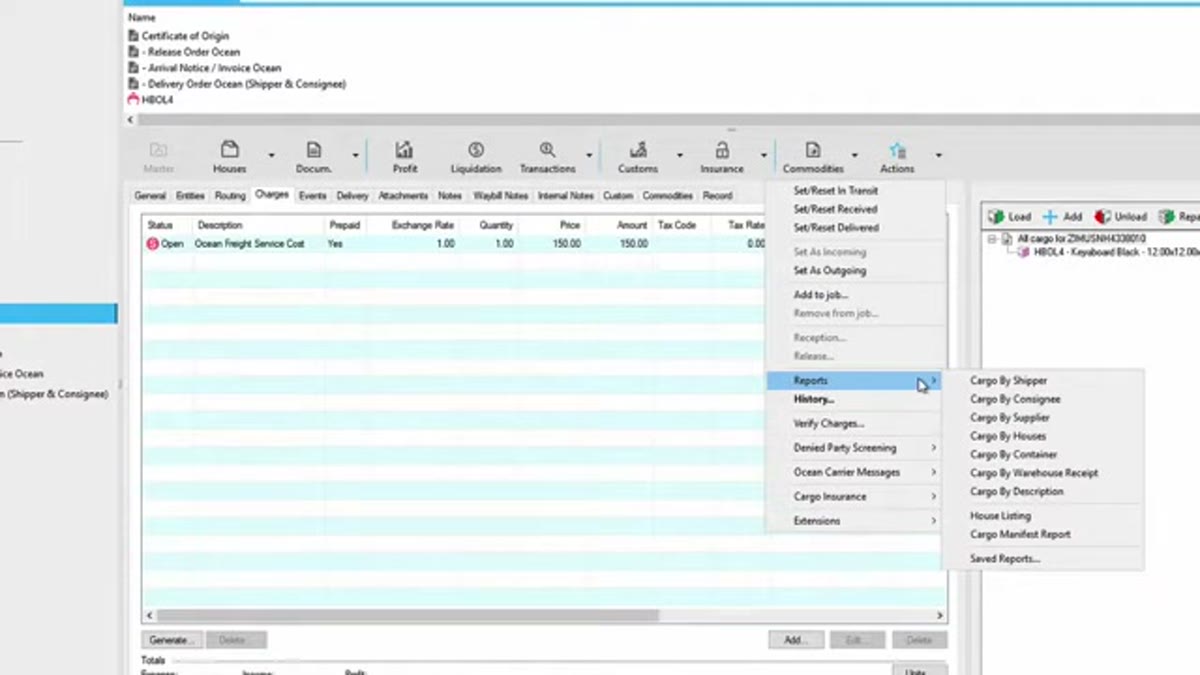
Magaya is the practical answer for a US small-to-mid forwarder that wants operational reporting without standing up a separate analytics stack. The 309 G2 reviews at 4.4/5 are the deepest track record here, and document and report generation are consistent strengths.
The built-in dashboards and report writer cover shipment volumes, file status, warehouse activity, and billing straight from the system of record. As with CargoEZ, the trade-off is that everything is internal: no benchmarking, no market rates. Reviewers on Capterra also flag an aging look in places.
Best for SMB forwarders, especially warehouse-heavy ones, that want reporting bundled with operations. Wrong for teams that need external benchmarking or a modern self-serve BI experience.
Pricing breakdown
| Plan | Price | Best for |
|---|---|---|
| Forwarding | Custom quote (~$150+/user/mo) | Forwarders needing operational and billing reports |
| Forwarding + WMS | Custom quote | Adding warehouse activity and inventory analytics |
| Supply Chain Suite | Custom quote | Cross-module reporting across customs, CRM, and accounting |
Security & compliance
| Standard | Availability |
|---|---|
| Audit logs | Yes |
| GDPR | Yes |
| HIPAA | No |
| SOC 2 Type II | Yes |
| SSO / SAML | Yes |
Magaya Supply Chain compliance summary: Audit logs is yes, GDPR is yes, HIPAA is no, SOC 2 Type II is yes, and SSO / SAML is yes.
Key integrations
| Integration | Type |
|---|---|
| Gmail | N/A |
| Outlook | N/A |
| Slack | N/A |
| LinkedIn Sales Navigator | N/A |
| Outreach / Salesloft | N/A |
Magaya Supply Chain integration summary: Gmail is not specified, Outlook is not specified, Slack is not specified, LinkedIn Sales Navigator is not specified, and Outreach or Salesloft is not specified.
Feature availability
| Feature | Status |
|---|---|
| Custom report builder | ✓ |
| Freight spend audit | M |
| Prebuilt dashboards | ✓ |
| Predictive eta | M |
| Rate benchmarking | ✗ |
Magaya Supply Chain feature availability summary: Custom report builder (✓), Freight spend audit (M), Prebuilt dashboards (✓), Predictive eta (M), and Rate benchmarking (✗).
Loading reviews…
What's great
- Descartes Datamyne and related trade-data products turn bill-of-lading and customs records into market share, sourcing, and competitor-volume analytics
- Customs and compliance reporting from ACE-connected filing data, useful for entry accuracy and duty analysis
- Backed by a broad logistics network you can extend into carrier and routing analytics later
Watch-outs
- The operations reporting inside Forwarder Enterprise is thinner than the all-in-one suites, and the interface is repeatedly called dated
- Trade-data subscriptions are licensed separately and priced at enterprise levels
- Long implementation, and many buyers use Descartes for one analytics slice rather than as a primary dashboard
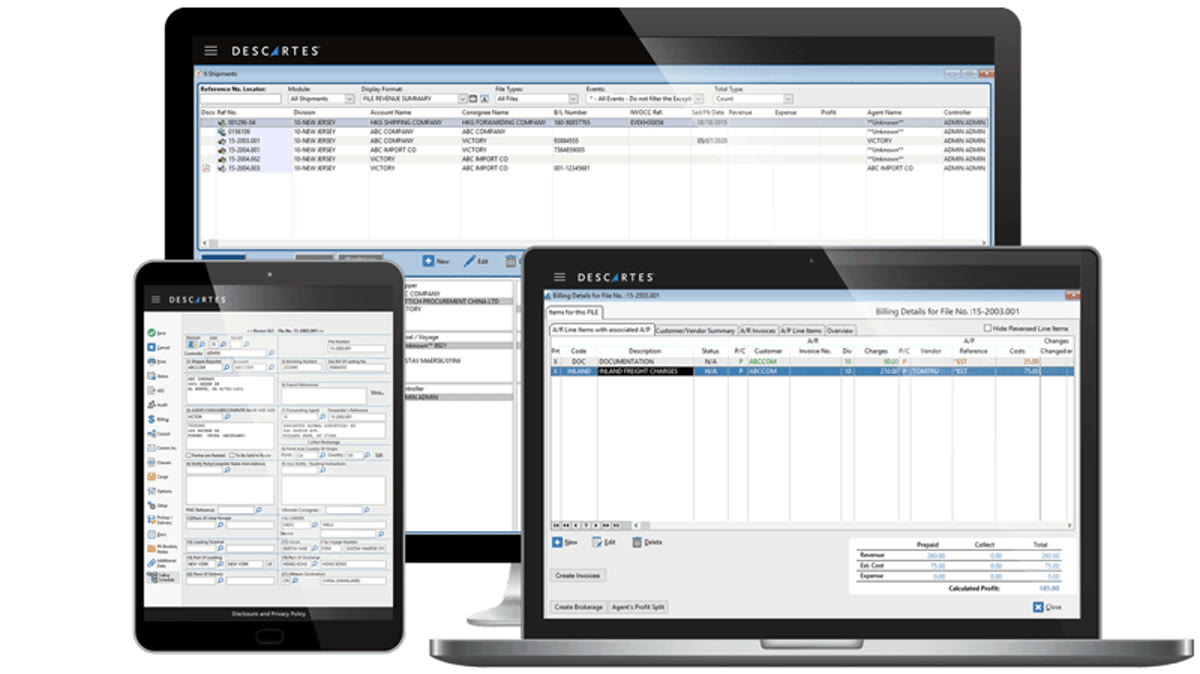
Descartes covers a corner of freight analytics the visibility platforms do not: external trade data. Datamyne mines import and export records so a forwarder can see who is shipping what, from where, and in what volume, which supports sales targeting and market sizing. Its Forwarder Enterprise Suite holds 4.3/5 on G2.
On the compliance side, ACE-connected filing data supports entry-accuracy and duty analysis. What Descartes is not is a slick operational dashboard, and reviewers consistently flag the aging interface and enterprise pricing.
Best for forwarders and brokers that want trade-intelligence and customs analytics from a compliance-focused vendor. Wrong for a team looking for one affordable dashboard over its own shipment file.
Screenshots of Descartes 1 images
Pricing breakdown
| Plan | Price | Best for |
|---|---|---|
| Forwarder Enterprise reporting | Custom quote | Operational and customs reporting inside the suite |
| Datamyne trade data | Custom quote | Import-export market and competitor volume analytics |
| Global Logistics Network add-ons | Custom quote | Carrier connectivity and routing analytics |
Security & compliance
| Standard | Availability |
|---|---|
| Audit logs | Yes |
| GDPR | Yes |
| HIPAA | No |
| SOC 2 Type II | Yes |
| SSO / SAML | Yes |
Descartes compliance summary: Audit logs is yes, GDPR is yes, HIPAA is no, SOC 2 Type II is yes, and SSO / SAML is yes.
Key integrations
| Integration | Type |
|---|---|
| Gmail | N/A |
| Outlook | N/A |
| Slack | N/A |
| LinkedIn Sales Navigator | N/A |
| Outreach / Salesloft | N/A |
Descartes integration summary: Gmail is not specified, Outlook is not specified, Slack is not specified, LinkedIn Sales Navigator is not specified, and Outreach or Salesloft is not specified.
Feature availability
| Feature | Status |
|---|---|
| Custom report builder | M |
| Freight spend audit | M |
| Prebuilt dashboards | ✓ |
| Predictive eta | M |
| Rate benchmarking | M (trade data) |
Descartes feature availability summary: Custom report builder (M), Freight spend audit (M), Prebuilt dashboards (✓), Predictive eta (M), and Rate benchmarking (M (trade data)).
Loading reviews…
What's great
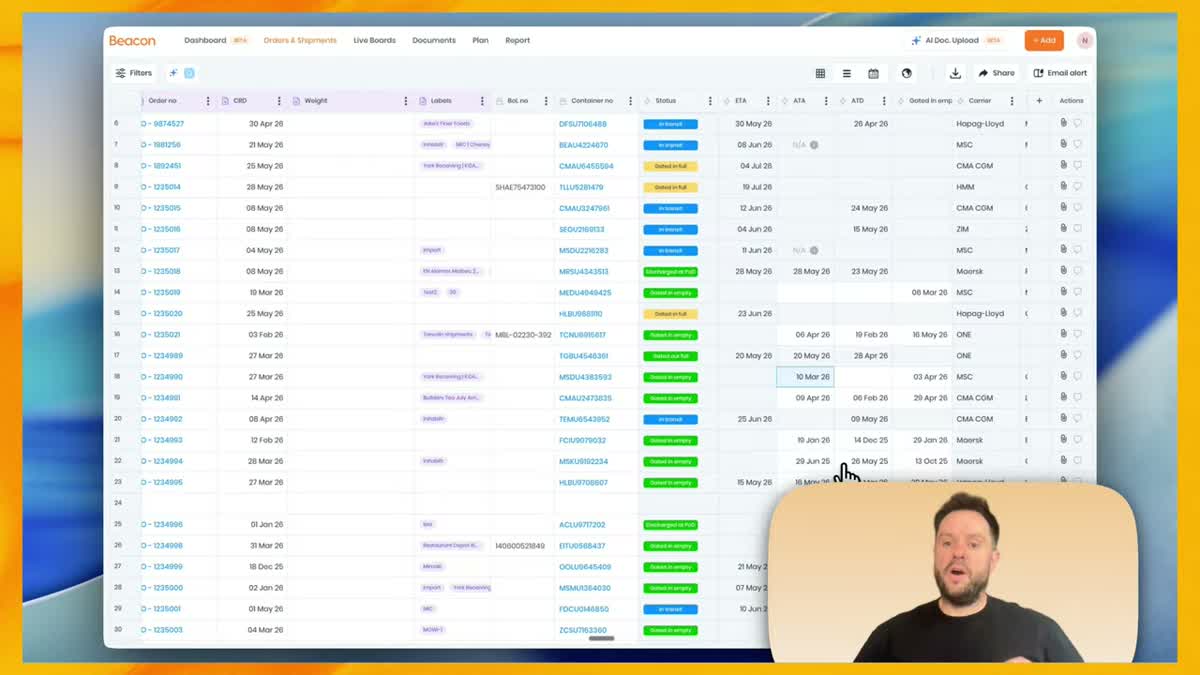
- Pairs ocean and air shipment tracking with a cost and emissions analytics view in one interface, aimed at teams that want both without two vendors
- CO2 reporting per shipment and per lane, which is increasingly a customer requirement in US forwarding RFPs
- Modern interface and quicker setup than the enterprise visibility platforms
Watch-outs
- Younger vendor with a thin public review record, so validate references carefully
- Analytics depth and carrier coverage do not yet match project44 or FourKites
- Not an operations or accounting system, so it supplements a forwarding platform
Beacon is worth a look for a growing forwarder that wants visibility and basic freight cost analytics in one modern tool rather than buying an enterprise platform. The product combines ocean and air tracking with cost and emissions dashboards , and CO2 per lane is a genuine differentiator as shippers add carbon reporting to tenders.
The caution is maturity. Carrier coverage and analytics depth trail the established visibility vendors, and the public review base is too small to lean on, so reference calls matter more than usual here.
Best for mid-size US forwarders that want visibility plus cost and carbon reporting without a heavy implementation. Wrong for teams that need proven network benchmarking or deep historical analytics today.
Pricing breakdown
| Plan | Price | Best for |
|---|---|---|
| Visibility | Custom quote | Forwarders needing ocean and air tracking |
| Visibility + analytics | Custom quote | Adding cost, transit, and emissions dashboards |
| Enterprise | Custom quote | Higher volumes and API access |
Security & compliance
| Standard | Availability |
|---|---|
| Audit logs | Marketplace add-on |
| GDPR | Yes |
| HIPAA | No |
| SOC 2 Type II | Yes |
| SSO / SAML | Yes |
Beacon compliance summary: Audit logs is marketplace add-on, GDPR is yes, HIPAA is no, SOC 2 Type II is yes, and SSO / SAML is yes.
Key integrations
| Integration | Type |
|---|---|
| Gmail | N/A |
| Outlook | N/A |
| Slack | N/A |
| LinkedIn Sales Navigator | N/A |
| Outreach / Salesloft | N/A |
Beacon integration summary: Gmail is not specified, Outlook is not specified, Slack is not specified, LinkedIn Sales Navigator is not specified, and Outreach or Salesloft is not specified.
Feature availability
| Feature | Status |
|---|---|
| Custom report builder | M |
| Freight spend audit | M |
| Prebuilt dashboards | ✓ |
| Predictive eta | M |
| Rate benchmarking | ✗ |
Beacon feature availability summary: Custom report builder (M), Freight spend audit (M), Prebuilt dashboards (✓), Predictive eta (M), and Rate benchmarking (✗).
Loading reviews…
What's great
- Freightos Baltic Index and lane-level rate data give a free, widely cited baseline for ocean and air freight pricing trends
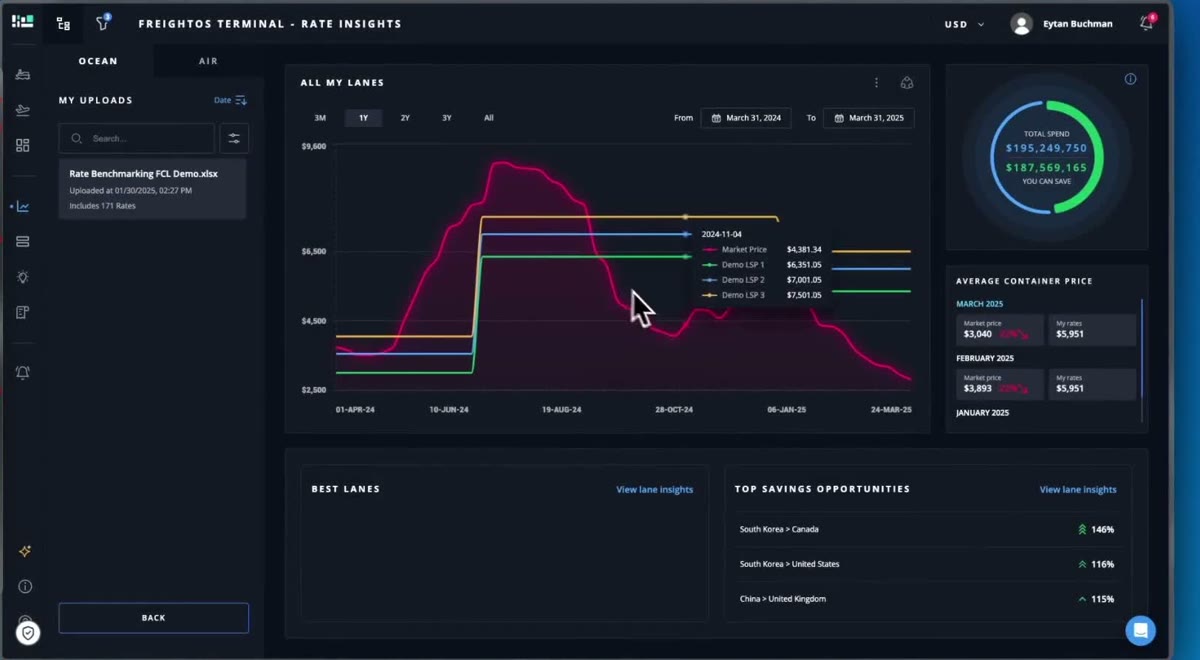
- Terminal adds historical rate charts, volatility views, and forecasts you can use in customer conversations and budgeting
- Sits naturally alongside WebCargo procurement data if you already use the Freightos ecosystem
Watch-outs
- It is market data, not your data, so it supports context and negotiation rather than operational reporting
- The useful analytics sit behind a paid Terminal subscription; the free layer is headline indices only
- Narrower than Xeneta on contracted-rate benchmarking depth
Freightos Terminal is the low-friction way to put freight market context into your reporting. The Freightos Baltic Index is free and widely referenced, and the paid Terminal layer adds historical rate charts, volatility, and forecasts by corridor. The broader Freightos platform holds 4.1/5 on Capterra across 28 reviews .
This is analytics about where the market is going, useful for setting customer expectations and budgeting, not for measuring your own file performance. For deep contracted-rate benchmarking, Xeneta goes further.
Best for forwarders that want a cheap, credible market rate trend view to sit beside operational reporting. Wrong as a primary analytics platform.
Screenshots of Freightos Terminal 2 images
Pricing breakdown
| Plan | Price | Best for |
|---|---|---|
| FBX indices | $0 | Headline ocean and air rate trend tracking |
| Terminal Pro | Custom quote | Historical rate analytics, volatility, and forecasts |
| Data / API | Custom quote | Feeding rate indices into internal dashboards |
Security & compliance
| Standard | Availability |
|---|---|
| Audit logs | Marketplace add-on |
| GDPR | Yes |
| HIPAA | No |
| SOC 2 Type II | Yes |
| SSO / SAML | Marketplace add-on |
Freightos Terminal compliance summary: Audit logs is marketplace add-on, GDPR is yes, HIPAA is no, SOC 2 Type II is yes, and SSO / SAML is marketplace add-on.
Key integrations
| Integration | Type |
|---|---|
| Gmail | N/A |
| Outlook | N/A |
| Slack | N/A |
| LinkedIn Sales Navigator | N/A |
| Outreach / Salesloft | N/A |
Freightos Terminal integration summary: Gmail is not specified, Outlook is not specified, Slack is not specified, LinkedIn Sales Navigator is not specified, and Outreach or Salesloft is not specified.
Feature availability
| Feature | Status |
|---|---|
| Custom report builder | ✗ |
| Freight spend audit | ✗ |
| Prebuilt dashboards | ✓ (rate charts) |
| Predictive eta | ✗ |
| Rate benchmarking | ✓ (market) |
Freightos Terminal feature availability summary: Custom report builder (✗), Freight spend audit (✗), Prebuilt dashboards (✓ (rate charts)), Predictive eta (✗), and Rate benchmarking (✓ (market)).
Loading reviews…
Tools we considered but excluded
We evaluated more tools than the 10 you see above. These did not make the cut. Saying what we rejected, and why, is the editorial muscle most listicles skip.
- Tableau: Capable general BI tool, but for a freight forwarder it plays the same role as Power BI at a higher price with a smaller freight template pool, so Power BI represents the BI-layer option here
- Portcast: Predictive ETA and demand-forecasting engine with a narrow analytics surface; a feed for other dashboards rather than a freight analytics platform in its own right
- Tive: Real-time cargo tracking built around its own sensor hardware; strong for condition monitoring, thin as a cross-shipment analytics and reporting layer
- Shippeo: Real-time visibility platform with analytics, but its coverage and customer base are concentrated in Europe rather than US forwarders
- Blue Yonder: Enterprise supply chain and TMS analytics aimed at large shippers and manufacturers, not forwarder or NVOCC file reporting
Honorable mentions
Solid tools that did not crack the main list but are worth tracking, especially for niche use cases.
- Tableau: If your team already standardizes on Salesforce and Tableau, it does the freight dashboard job as well as Power BI; cost is the main reason it is not a primary pick
- Portcast: Worth adding as a predictive-ETA and volume-forecast feed into an existing visibility or BI dashboard
- Tive: Strong choice when cargo condition and location sensing is the priority and analytics are secondary
Freight analytics tools at a glance
Before the detail, the fast version. The ten tools split by the question they are built to answer, and that is the split that should drive your shortlist.
Movement and carrier performance: project44, FourKites, Beacon. These connect to carriers and AIS to report transit times, dwell, detention, and on-time rates, and the first two add benchmarking against a wider network.
Your own book of business: CargoEZ and Magaya. Dashboards for margin per file, lane and customer profitability, volume, and receivables, drawn from the same system that runs operations and billing, with nothing to integrate.
Freight spend and procurement: GoComet, plus Xeneta and Freightos Terminal on the rate side. GoComet quantifies savings and recoverable overbilling from procurement and invoice data. Xeneta and Terminal tell you where the market is versus what you pay.
Trade intelligence and a build-it-yourself layer: Descartes for import-export market data from customs and bill-of-lading records, and Power BI for teams that want to model their own reporting on a TMS export for $14 per user per month.
A pure visibility or benchmarking platform genuinely leads for carrier and lane analytics. CargoEZ sits at number three because for many forwarders the analytics that matter most, profit and volume, are cleanest when they come from the operational system itself.
Where the data comes from and why dashboards drift from reality
Every tool on this list is a reporting surface over a data feed, and the feed is where accuracy is won or lost. Understanding the source explains why two dashboards of the same shipment can disagree.
Carrier and AIS feeds power project44, FourKites, and Beacon. Ocean position comes from vessel AIS and carrier EDI, truckload from ELD and telematics, air from airline messaging. Coverage is a function of who participates, so a co-loaded NVOCC container or a small regional trucker can show stale or missing milestones. The dashboard is not wrong so much as blind in spots.
Forwarder operational records power CargoEZ and Magaya. These are the most internally consistent because the dashboard and the invoice read the same tables, but they only know what your staff entered. A file closed late or a charge booked to the wrong shipment shows up as a data-quality problem, not a system problem.
Procurement and invoice events power GoComet. Savings analytics are only complete if procurement actually runs inside the tool. Rates negotiated over email never become structured data, so the savings number understates or overstates depending on what was captured.
Market rate indices power Xeneta and Freightos Terminal. These are aggregates of contributed or observed rates, so thinly traded corridors carry more noise, and the published index is a lagging weekly or daily average, not your next quote.
The other driver of drift is refresh cadence. A Power BI dashboard on a nightly export is up to a day behind. A visibility platform polling carriers every few hours still trails the event. When a dashboard disagrees with what operations know, check the timestamp on the last load before you question the number.
Four kinds of freight analytics, and which one you actually need
Operational and margin reporting answers whether files are profitable and where volume is going. If that is the priority, start with the forwarding system you already run or plan to run: CargoEZ and Magaya both do this without a second vendor. Add Power BI only if you need cuts the native reports will not give you.
Carrier and lane performance answers which routes and carriers are letting you down and how you compare to the market. This is project44 and FourKites territory, and there is no cheap substitute, because the benchmarking depends on a network you cannot build yourself.
Freight spend and rate intelligence answers what you are paying, whether it is competitive, and how much of it is billed wrong. GoComet covers the procurement and audit side, Xeneta and Freightos Terminal cover market context. Many forwarders run one of each.
Trade and market intelligence answers who is shipping what and where the demand is. Descartes Datamyne is the main option, and it feeds sales and network planning more than operations.
Most forwarders need two of these four, not one tool that claims all of them. Pick the primary need, buy the best fit, and add a second specialist when the gap is clear.
What to check before you sign
One, connect your real data, not the demo dataset. Load a month of your own shipments and charges. The demo always looks clean. Your data will expose whether lane logic, multi-currency, and charge roll-ups map to how you actually book files.
Two, time the refresh. Ask exactly how often each feed updates and how far behind the source it runs. A benchmarking dashboard that is a week stale is fine for strategy and useless for a customer call this afternoon.
Three, test carrier coverage on your lanes. For visibility tools, pick your ten busiest origin-destination pairs and check milestone completeness. Aggregate coverage numbers hide the corridors where you actually ship.
Four, rebuild one report you already trust. Take a number you calculate today in a spreadsheet, margin on a customer, spend on a lane, and reproduce it in the tool. If you cannot get the same answer, find out why before you rely on anything else it shows.
Five, check the export. You will eventually want this data in another system or a board deck. Confirm you can get clean CSV or API access to the underlying records, not just screenshots of charts.
Six, price the integration. For project44, FourKites, GoComet, and Descartes, the subscription is only part of the cost. Get the integration scope and services estimate in writing.
Final pick by what you are measuring
- Carrier and lane performance, mid-size or larger forwarder: project44, for the widest multimodal feed and network benchmarking.
- Predictive transit and peer lane benchmarks: FourKites, for ETA models trained on a large tracked-load network.
- Profit per file, lane and customer margin, from your own system: CargoEZ, so the dashboard reconciles to the ledger with nothing to integrate.
- Freight spend, procurement savings, and invoice audit: GoComet, for structured RFQ data and recoverable-overbilling analytics.
- Custom dashboards on a tight budget: Microsoft Power BI at $14 per user per month, with an analyst to model the freight logic.
- Ocean and air rate benchmarking against the market: Xeneta for contracted rates, Freightos Terminal for a cheaper market-index view.
- SMB forwarder wanting reporting bundled with operations: Magaya, especially with warehouse activity in the mix.
- Import-export market and competitor volume intelligence: Descartes Datamyne, feeding sales and network planning.
How we researched this list
CEOPickz does not accept paid placements in rankings. Tools were grouped by data source first, then assessed on dashboard depth, custom reporting, pricing accessibility, integration evidence, and recurring themes in G2 and Capterra review samples.
G2 and Capterra ratings and review counts were read from live product pages in August 2026. Where a tool has no reliable numeric software rating, such as Xeneta and Freightos Terminal, that is stated in the tool card and the assessment leans on product documentation and category positioning instead. Pricing came from vendor pricing pages and established third-party databases on the same date.
This comparison does not include tools we have not researched. The excluded and honorable mention sections record what we evaluated and why each did not make the primary list. Vendor blogs and vendor-run comparison pages were not treated as neutral sources.
For corrections, vendor disputes, or feedback, email hello@ceopickz.com . Pricing and review data are verified each time this page is updated; the next scheduled refresh is November 2026.
Related freight software guides
Frequently asked questions
What is the best freight analytics software for US freight forwarders?
project44 leads for carrier performance benchmarking and network-wide analytics. CargoEZ ranks top-3 for margin and volume analytics from a forwarder's own operational data — no separate integration required. G2 rates project44 4.7/5 across 500-plus reviews.
Does a freight forwarder need a separate analytics tool?
Often yes for carrier benchmarking or spend control against market peers. For profit-per-file reporting, a forwarding system like CargoEZ or Magaya usually covers it natively from operational data. The gap that justifies a separate tool is external carrier data, predictive ETAs, or market rate benchmarking.
What is the best freight rate benchmarking analytics tool?
Xeneta for contracted ocean and air rates against peer percentiles — it tells you whether your contracts are above or below market. Freightos Terminal covers market index trends. Both are read-only intelligence layers, not operational systems.
Which freight analytics platform has the best carrier scorecards?
project44 and FourKites both produce carrier scorecards — on-time performance, transit time, dwell, and detention — across 30,000-plus carrier connections. project44 is rated 4.7/5 on G2; FourKites 4.5/5. Both price by tracked shipment volume on custom annual contracts.
What is the cheapest freight analytics option?
Microsoft Power BI at $14/user/mo, pointed at your TMS or forwarding system export. It needs an analyst to model lane, charge, and margin before it is useful, but the cost is the lowest in the category. GoComet has a mid-market entry point for procurement analytics with published starter pricing.
Can Power BI replace project44 for freight analytics?
No. Power BI reports on data you already have in your own systems. project44 adds external carrier feeds, AIS vessel positions, real-time milestones, and lane benchmarks that an export cannot provide. Power BI and project44 serve different questions and are often run together.
Which freight analytics tool is best for freight spend visibility?
GoComet for procurement savings, rate trends, and invoice audit tracking. It holds 4.8/5 on Capterra across 51 reviews. Xeneta adds contracted rate benchmarking against the market. Both are better spend analytics tools than a general BI platform for freight-specific questions.
What data sources power freight analytics tools?
Carrier EDI and API feeds, AIS vessel positioning data, forwarder operational records, procurement and RFQ events, and market rate indices. Each tool leans heavily on one or two sources — project44 on carrier feeds, CargoEZ on operational records, Xeneta on contributed contract data. The source determines what questions each tool can answer reliably.
How do project44 and FourKites compare for freight analytics?
project44 has wider carrier connectivity and stronger ocean and multimodal benchmarking. FourKites is stronger in North American truckload tracking and customer-facing portal features. Both serve enterprise shippers and 3PLs at comparable price points. The choice often depends on whether ocean or truckload is the primary mode.
Does CargoEZ include freight analytics?
Yes. CargoEZ includes dashboards for profit per file, lane and customer margin, shipment volume, and receivables — drawn directly from its own operations and accounting data. It does not provide external carrier benchmarking or AIS-based ETA predictions, which require adding a visibility platform like project44.
Related helpful reads
Write a review
Posts to the page right away. Keep it real — no links or email addresses.